Route density — stops per mile, or more precisely stops per driver-hour — is the single metric that separates profitable last-mile operations from ones that grind through margin without building it. High-volume national players have solved this problem with volume: enough stops per zone that every driver can maintain 4-6 stops per hour throughout the day. Regional carriers running 12 to 40 vehicles over a 50-to-150-mile radius almost never hit those numbers. And the standard advice — add volume, expand your customer base, negotiate higher stop rates — misses what's actually causing the density problem.
I've spent the last two years building routing systems for exactly this kind of fleet. The density gap isn't primarily a volume problem. It's a sequencing problem. And sequencing is solvable at regional carrier scale without requiring national carrier stop counts.
What route density actually measures
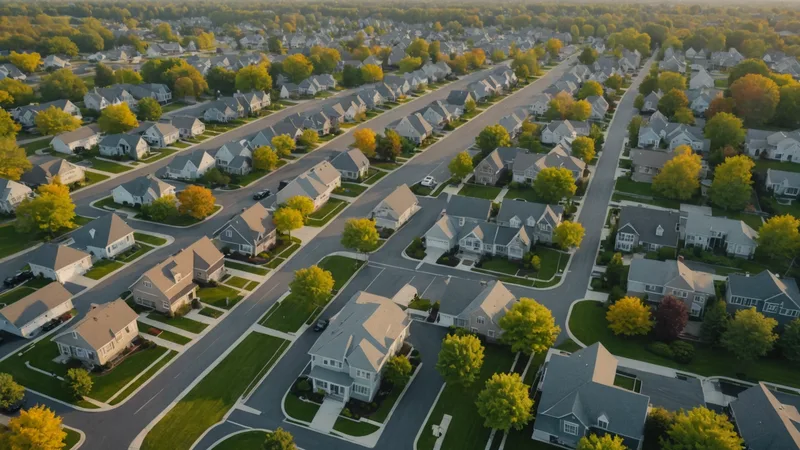
Stop density in a geographic sense — how many stops exist per square mile in your service territory — is largely fixed. You serve who you serve. You can't manufacture more customers in a zone to improve density. What you can change is the density of stops per driver-hour, which is a function of how efficiently your drivers move through the stops you have.
The relevant metric is stops-per-route-hour, not stops-per-route. A driver doing 28 stops in 9 hours achieves 3.1 stops per hour. A driver doing 24 stops in 6.5 hours achieves 3.7. The second driver has fewer stops but is more productive — and more profitable on a per-stop basis — because the sequencing is tighter and the inter-stop travel time is lower.
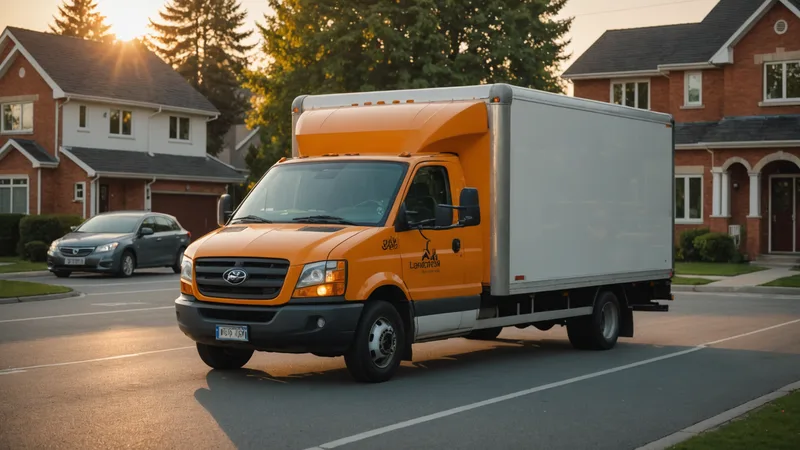
Route density in the operational sense is fundamentally about minimizing dead miles: the distance (and time) a driver spends moving between stops without delivering anything. Regional carriers with dispersed territories tend to have high dead-mile ratios, especially in suburban rings like the eastern Columbus exurbs along Route 40 or the low-density areas south of I-270. You can't change the geography, but you can change how efficiently your route graph navigates it.
Why the density problem compounds over the day
Here's the part that doesn't get talked about enough: route density degrades throughout the day even if it starts well. A route planned at 5 AM with good sequencing may have reasonable stops-per-hour through the morning peak. By 1 PM, between customer window changes, traffic pattern shifts, and dwell time variance, the same route can have gaps of 40-60 minutes between stops where the driver is either waiting or traveling. Those gaps are density killers.
The compounding effect works like this: one stop runs long (26-minute dwell instead of 11) which pushes the driver past a downstream time window, which forces a skip-and-return — two dead-mile segments (skip past, come back) instead of one forward movement. One skip-and-return on a 28-stop route can easily add 30-45 minutes of dead time to the back half of the day. At $0.85-1.10 per vehicle-mile for a typical diesel delivery van, that's not just time, it's operating cost.
High-density operators like large parcel networks solve this by having so many stops per zone that even after skips and returns, the driver still hits their hourly rate. Regional carriers don't have that buffer. When something goes wrong in the middle of a regional carrier's route, there's no density cushion to absorb it.
The two ways carriers try to buy their way out
The first approach is geographic expansion: take on more customers in adjacent zones to increase the stop count per vehicle. This works in theory but has two problems. The new stops often aren't in the tight geographic clusters you need — they're scattered across a broader service area, which increases dead miles rather than reducing them. And the operational complexity of managing more stops per driver eventually outpaces the density benefit.
The second approach is adding vehicles: reduce the geographic range per driver so each driver has a tighter, denser territory. This is basically buying density by dividing the problem into smaller pieces. It works as long as your fixed cost per vehicle is low enough. Once you're paying CDL driver wages, insurance, and maintenance on a vehicle that's not achieving minimum productivity thresholds, you're trading one problem for another.
We're not saying expansion or fleet growth is the wrong strategy — they're often correct for other business reasons. We're saying neither solves the sequencing-layer density problem. A 30-vehicle fleet with bad sequencing has worse stops-per-hour than a well-optimized 18-vehicle fleet covering similar territory.
What algorithmic re-sequencing actually does to density
Re-sequencing works on route density through two mechanisms.
The first is intra-day cluster optimization. As stops complete and real dwell times come in, the routing engine can tighten the sequence for the remaining stops using actual data rather than estimates. If stops 14-20 are clustered geographically but were originally sequenced with time-window constraints that spread them across the afternoon, and those window constraints turn out to be softer than they looked, the engine can compress them into a tighter window. Fewer dead miles for the same stops.
The second mechanism is traffic-aware dead-mile reduction. During morning rush on I-70 east of Columbus, certain stop sequences that look efficient on a map are actually slow because of congestion patterns. A routing engine that updates every 15 minutes against live traffic can identify when an alternate sequencing — slightly longer in miles — is faster in time and achieves better stops-per-hour. Static routes planned at 5 AM can't capture this because the traffic data didn't exist yet.
The combined effect of these two mechanisms, across a typical 15-stop afternoon run, is usually 3-6 fewer dead-mile segments per driver per day. At regional carrier operating costs, that's $12-$22 per vehicle per day in recovered operating cost, plus the compounding effect of fewer cascading delays.
Density as a service-quality constraint, not just a cost constraint
There's a version of this conversation that stays purely in cost terms. I want to flag that route density also has a service-quality dimension that matters for regional carriers specifically.
When your stops-per-hour is low, your drivers are spending more time in transit between stops and less time at customer locations. That means when something requires driver judgment at a stop — a partial delivery, a receiving dock issue, a signature dispute — there's more time pressure because the driver's head is in the next stop, not the current one. Quality of delivery interactions tends to be better when drivers aren't racing to make up time lost to poor sequencing.
Regional carriers compete on reliability and relationship, not just price. A regional distributor serving a tight network of restaurant accounts along the Short North and Clintonville corridors of Columbus has relationships with those businesses that a national parcel carrier doesn't. Protecting those relationships means showing up in the promised window, every time, which requires density management — not just at planning time, but throughout the delivery day.
The practical threshold
In our experience, continuous re-sequencing has the most measurable density impact on fleets where routes have more than 18 stops and service territories span at least 35-40 square miles. Below that threshold, the gains from dynamic re-sequencing are real but small enough that simpler optimization may suffice. Above it, the compounding of dead-mile reduction and cascade-delay prevention produces outcomes that static routing simply can't match, regardless of how good the morning plan was.
The density problem is structural, but it's not immovable. You just need to be working on it at the right layer of the problem — not adding trucks and not chasing volume, but making the routing itself more efficient every 15 minutes of the operating day.